Summary Market Segment as follows: By Region Asia-Pacific North America Europe South America Middle East & Africa By Type Air to Water Monobloc Heat Pumps Air to Water Cylinder Heat Pumps Groundwater Heat Pump Split air-to-water heat pumps Exhaust Air Heat Pumps By Application Papermaking Industrial Food Industrial Chemical Automobile Oil Refining Industrial Metal Industrial Others By Company Emerson Electric Johnson Controls Mitsubishi Electric Corporation Bosch Daikin United Technologies Oilon Danfoss ARANER Fujitsu General LG Electronics Panasonic Carrier NIBE Kobe Steel Vicking Heating Engines Ochsner Energie Technik Hybrid Energy Mayekawa Conhitherm Durr Thermea Friotherm Star Refrigeration GEA Refrigeration Frigel Gree Electric Stiebel Eltron Swegon Group Sanden International Aermec Glen Dimplex Vaillant A. O. Smith Viessmann BDR Thermea Group The main contents of the report including: Section 1: Product definition, type and application, global and regional market overview; Section 2: Global and regional Market competition by company; Section 3: Global and regional sales revenue, volume and price by type; Section 4: Global and regional sales revenue, volume and price by application; Section 5: Regional export and import; Section 6: Company information, business overview, sales data and product specifications; Section 7: Industry chain and raw materials; Section 8: SWOT and Porter's Five Forces; Section 9: Conclusion.
This research study involves broad usage of both secondary and primary data sources. The research process involves the identification of numerous factors which affect the industry, comprising the market environment, government policy, historical data, present trends in the market, competitive landscape, technological innovation, upcoming technologies and the technical progress in related industry, and market risks, opportunities, market barriers and challenges.
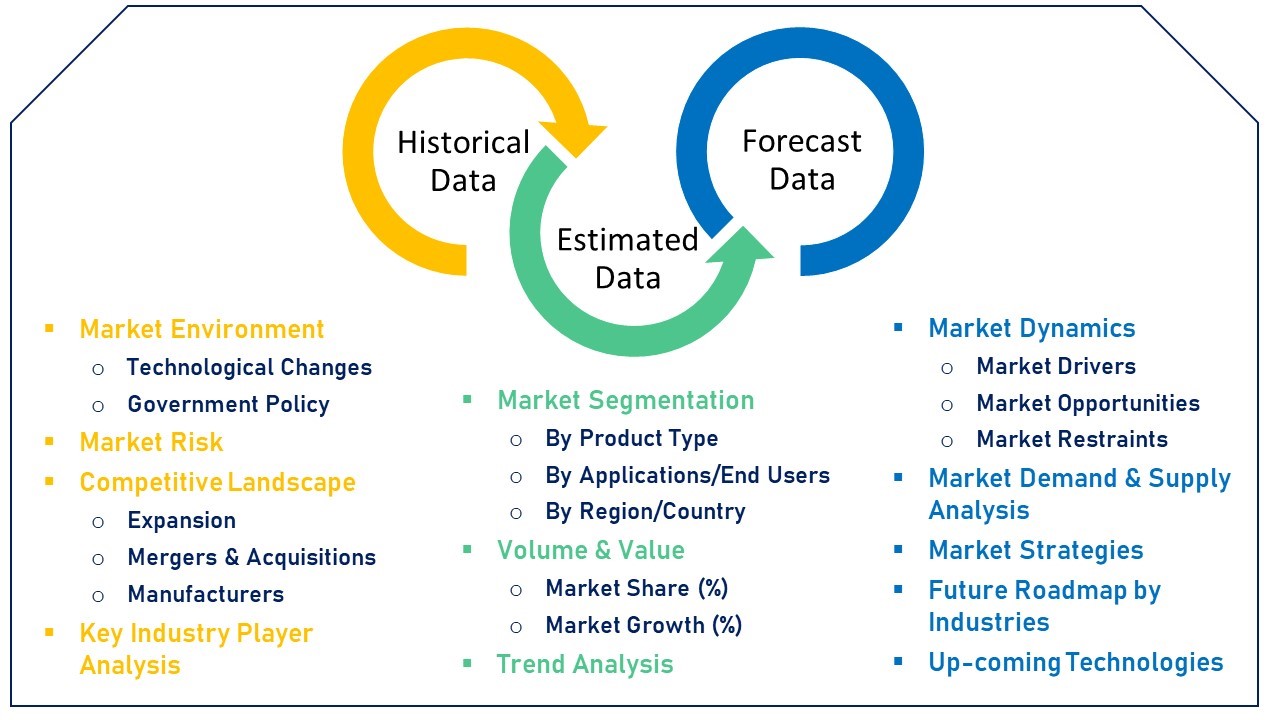
Market Estimation
Top-down and bottom-up approaches are used for validating the market size for companies, regional segments along with relevant market segmentations such as product type and application.
This report includes market estimations which are based on the marketed sale price of a product. Further breakdown of product segments, particular market share are formed based on the weightage assigned to every segment, which is derived of their usage rate and average price. The entire probable factors which effect the markets and influence them in a great way are included in this research report; and have been accounted for, studied in-depth and are confirmed through primary research. These are then studies to get the final qualitative and quantitative data. Any of the factors such as the outcome of inflation, economic downfall, and any kind of policy and regulatory alterations and/or other such factors are not accounted for in the market forecast. All of this data is amalgamated and included with thorough inputs and analysis from Gravitas Market Insights is curated in this report.

Along with the previously mentioned approaches, various data triangulation methods, in order to conduct market estimations and market forecasting for the complete market segments are detailed in this report. Key Companies present in the said market are also acknowledged via in-depth secondary research and primary research.
Table of Contents 1 Market Overview 1.1 Market Segment Overview 1.1.1 Product Definition 1.1.2 Market by Type 1.1.2.1 Air to Water Monobloc Heat Pumps Figure Air to Water Monobloc Heat Pumps Market Size and CAGR 2015-2020 (Million USD) Figure Air to Water Monobloc Heat Pumps Market Size and CAGR 2015-2020 (Volume) Figure Air to Water Monobloc Heat Pumps Market Forecast and CAGR 2020-2025 (Million USD) Figure Air to Water Monobloc Heat Pumps Market Forecast and CAGR 2020-2025 (Volume) 1.1.2.2 Air to Water Cylinder Heat Pumps Figure Air to Water Cylinder Heat Pumps Market Size and CAGR 2015-2020 (Million USD) Figure Air to Water Cylinder Heat Pumps Market Size and CAGR 2015-2020 (Volume) Figure Air to Water Cylinder Heat Pumps Market Forecast and CAGR 2020-2025 (Million USD) Figure Air to Water Cylinder Heat Pumps Market Forecast and CAGR 2020-2025 (Volume) 1.1.2.3 Groundwater Heat Pump Figure Groundwater Heat Pump Market Size and CAGR 2015-2020 (Million USD) Figure Groundwater Heat Pump Market Size and CAGR 2015-2020 (Volume) Figure Groundwater Heat Pump Market Forecast and CAGR 2020-2025 (Million USD) Figure Groundwater Heat Pump Market Forecast and CAGR 2020-2025 (Volume) 1.1.2.4 Split air-to-water heat pumps Figure Split air-to-water heat pumps Market Size and CAGR 2015-2020 (Million USD) Figure Split air-to-water heat pumps Market Size and CAGR 2015-2020 (Volume) Figure Split air-to-water heat pumps Market Forecast and CAGR 2020-2025 (Million USD) Figure Split air-to-water heat pumps Market Forecast and CAGR 2020-2025 (Volume) 1.1.2.5 Exhaust Air Heat Pumps Figure Exhaust Air Heat Pumps Market Size and CAGR 2015-2020 (Million USD) Figure Exhaust Air Heat Pumps Market Size and CAGR 2015-2020 (Volume) Figure Exhaust Air Heat Pumps Market Forecast and CAGR 2020-2025 (Million USD) Figure Exhaust Air Heat Pumps Market Forecast and CAGR 2020-2025 (Volume) 1.1.3 Market by Application 1.1.3.1 Papermaking Industrial Figure Papermaking Industrial Market Size and CAGR 2015-2020 (Million USD) Figure Papermaking Industrial Market Size and CAGR 2015-2020 (Volume) Figure Papermaking Industrial Market Forecast and CAGR 2020-2025 (Million USD) Figure Papermaking Industrial Market Forecast and CAGR 2020-2025 (Volume) 1.1.3.2 Food Industrial Figure Food Industrial Market Size and CAGR 2015-2020 (Million USD) Figure Food Industrial Market Size and CAGR 2015-2020 (Volume) Figure Food Industrial Market Forecast and CAGR 2020-2025 (Million USD) Figure Food Industrial Market Forecast and CAGR 2020-2025 (Volume) 1.1.3.3 Chemical Figure Chemical Market Size and CAGR 2015-2020 (Million USD) Figure Chemical Market Size and CAGR 2015-2020 (Volume) Figure Chemical Market Forecast and CAGR 2020-2025 (Million USD) Figure Chemical Market Forecast and CAGR 2020-2025 (Volume) 1.1.3.4 Automobile Figure Automobile Market Size and CAGR 2015-2020 (Million USD) Figure Automobile Market Size and CAGR 2015-2020 (Volume) Figure Automobile Market Forecast and CAGR 2020-2025 (Million USD) Figure Automobile Market Forecast and CAGR 2020-2025 (Volume) 1.1.3.5 Oil Refining Industrial Figure Oil Refining Industrial Market Size and CAGR 2015-2020 (Million USD) Figure Oil Refining Industrial Market Size and CAGR 2015-2020 (Volume) Figure Oil Refining Industrial Market Forecast and CAGR 2020-2025 (Million USD) Figure Oil Refining Industrial Market Forecast and CAGR 2020-2025 (Volume) 1.1.3.6 Metal Industrial Figure Metal Industrial Market Size and CAGR 2015-2020 (Million USD) Figure Metal Industrial Market Size and CAGR 2015-2020 (Volume) Figure Metal Industrial Market Forecast and CAGR 2020-2025 (Million USD) Figure Metal Industrial Market Forecast and CAGR 2020-2025 (Volume) 1.1.3.7 Others Figure Others Market Size and CAGR 2015-2020 (Million USD) Figure Others Market Size and CAGR 2015-2020 (Volume) Figure Others Market Forecast and CAGR 2020-2025 (Million USD) Figure Others Market Forecast and CAGR 2020-2025 (Volume) 1.2 Global and Regional Market Size 1.2.1 Global Overview Figure Global Industrial Heat Pumps Market Size and CAGR 2015-2020 (Million USD) Figure Global Industrial Heat Pumps Market Size and CAGR 2015-2020 (Volume) Figure Global Industrial Heat Pumps Market Forecast and CAGR 2020-2025 (Million USD) Figure Global Industrial Heat Pumps Market Forecast and CAGR 2020-2025 (Volume) 1.2.2 Market by Region 1.2.2.1 Asia-Pacific Figure Asia-Pacific Industrial Heat Pumps Market Size and CAGR 2015-2020 (Million USD) Figure Asia-Pacific Industrial Heat Pumps Market Size and CAGR 2015-2020 (Volume) Figure Asia-Pacific Industrial Heat Pumps Market Forecast and CAGR 2020-2025 (Million USD) Figure Asia-Pacific Industrial Heat Pumps Market Forecast and CAGR 2020-2025 (Volume) 1.2.2.2 North America Figure North America Industrial Heat Pumps Market Size and CAGR 2015-2020 (Million USD) Figure North America Industrial Heat Pumps Market Size and CAGR 2015-2020 (Volume) Figure North America Industrial Heat Pumps Market Forecast and CAGR 2020-2025 (Million USD) Figure North America Industrial Heat Pumps Market Forecast and CAGR 2020-2025 (Volume) 1.2.2.3 Europe Figure Europe Industrial Heat Pumps Market Size and CAGR 2015-2020 (Million USD) Figure Europe Industrial Heat Pumps Market Size and CAGR 2015-2020 (Volume) Figure Europe Industrial Heat Pumps Market Forecast and CAGR 2020-2025 (Million USD) Figure Europe Industrial Heat Pumps Market Forecast and CAGR 2020-2025 (Volume) 1.2.2.4 South America Figure South America Industrial Heat Pumps Market Size and CAGR 2015-2020 (Million USD) Figure South America Industrial Heat Pumps Market Size and CAGR 2015-2020 (Volume) Figure South America Industrial Heat Pumps Market Forecast and CAGR 2020-2025 (Million USD) Figure South America Industrial Heat Pumps Market Forecast and CAGR 2020-2025 (Volume) 1.2.2.5 Middle East & Africa Figure Middle East & Africa Industrial Heat Pumps Market Size and CAGR 2015-2020 (Million USD) Figure Middle East & Africa Industrial Heat Pumps Market Size and CAGR 2015-2020 (Volume) Figure Middle East & Africa Industrial Heat Pumps Market Forecast and CAGR 2020-2025 (Million USD) Figure Middle East & Africa Industrial Heat Pumps Market Forecast and CAGR 2020-2025 (Volume) 2 Global and Regional Market by Company 2.1 Global 2.1.1 Global Sales by Company Table Global Market Sales Revenue by Company 2015-2020 Table Global Market Sales Revenue Share by Company 2015-2020 Figure Global Market Sales Revenue Share by Company in 2020 Table Global Market Sales Volume by Company 2015-2020 Table Global Market Sales Volume Share by Company 2015-2020 Figure Global Market Sales Volume Share by Company in 2020 2.1.2 Global Price by Company Table Global Price by Company 2015-2020 2.2 Asia-Pacific 2.2.1 Asia-Pacific Sales by Company Table Asia-Pacific Market Sales Revenue by Company 2015-2020 Table Asia-Pacific Market Sales Revenue Share by Company 2015-2020 Figure Asia-Pacific Market Sales Revenue Share by Company in 2020 Table Asia-Pacific Market Sales Volume by Company 2015-2020 Table Asia-Pacific Market Sales Volume Share by Company 2015-2020 Figure Asia-Pacific Market Sales Volume Share by Company in 2020 2.2.2 Asia-Pacific Price by Company Table Asia-Pacific Price by Company 2015-2020 2.3 North America 2.3.1 North America Sales by Company Table North America Market Sales Revenue by Company 2015-2020 Table North America Market Sales Revenue Share by Company 2015-2020 Figure North America Market Sales Revenue Share by Company in 2020 Table North America Market Sales Volume by Company 2015-2020 Table North America Market Sales Volume Share by Company 2015-2020 Figure North America Market Sales Volume Share by Company in 2020 2.3.2 North America Price by Company Table North America Price by Company 2015-2020 2.4 Europe 2.4.1 Europe Market Sales by Company Table Europe Market Sales Revenue by Company 2015-2020 Table Europe Market Sales Revenue Share by Company 2015-2020 Figure Europe Market Sales Revenue Share by Company in 2020 Table Europe Market Sales Volume by Company 2015-2020 Table Europe Market Sales Volume Share by Company 2015-2020 Figure Europe Market Sales Volume Share by Company in 2020 2.4.2 Europe Price by Company Table Europe Price by Company 2015-2020 2.5 South America 2.5.1 South America Sales by Company Table South America Market Sales Revenue by Company 2015-2020 Table South America Market Sales Revenue Share by Company 2015-2020 Figure South America Market Sales Revenue Share by Company in 2020 Table South America Market Sales Volume by Company 2015-2020 Table South America Market Sales Volume Share by Company 2015-2020 Figure South America Market Sales Volume Share by Company in 2020 2.5.2 South America Price by Company Table South America Price by Company 2015-2020 2.6 Middle East & Africa 2.6.1 Middle East & Africa Sales by Company Table Middle East & Africa Market Sales Revenue by Company 2015-2020 Table Middle East & Africa Market Sales Revenue Share by Company 2015-2020 Figure Middle East & Africa Market Sales Revenue Share by Company in 2020 Table Middle East & Africa Market Sales Volume by Company 2015-2020 Table Middle East & Africa Market Sales Volume Share by Company 2015-2020 Figure Middle East & Africa Market Sales Volume Share by Company in 2020 2.6.2 Middle East & Africa Price by Company Table Middle East & Africa Price by Company 2015-2020 3 Global and Regional Market by Type 3.1 Global 3.1.1 Global Sales by Type Table Global Market Sales Revenue by Type 2015-2020 Table Global Market Sales Revenue Share by Type 2015-2020 Figure Global Market Sales Revenue Share by Type in 2020 Table Global Market Sales Volume by Type 2015-2020 Table Global Market Sales Volume Share by Type 2015-2020 Figure Global Market Sales Volume Share by Type in 2020 3.1.2 Global Price by Type Table Global Price by Type 2015-2020 3.2 Asia-Pacific 3.2.1 Asia-Pacific Sales by Type Table Asia-Pacific Market Sales Revenue by Type 2015-2020 Table Asia-Pacific Market Sales Revenue Share by Type 2015-2020 Figure Asia-Pacific Market Sales Revenue Share by Type in 2020 Table Asia-Pacific Market Sales Volume by Type 2015-2020 Table Asia-Pacific Market Sales Volume Share by Type 2015-2020 Figure Asia-Pacific Market Sales Volume Share by Type in 2020 3.2.2 Asia-Pacific Price by Type Table Asia-Pacific Price by Type 2015-2020 3.3 North America 3.3.1 North America Sales by Type Table North America Market Sales Revenue by Type 2015-2020 Table North America Market Sales Revenue Share by Type 2015-2020 Figure North America Market Sales Revenue Share by Type in 2020 Table North America Market Sales Volume by Type 2015-2020 Table North America Market Sales Volume Share by Type 2015-2020 Figure North America Market Sales Volume Share by Type in 2020 3.3.2 North America Price by Type Table North America Price by Type 2015-2020 3.4 Europe 3.4.1 Europe Market Sales by Type Table Europe Market Sales Revenue by Type 2015-2020 Table Europe Market Sales Revenue Share by Type 2015-2020 Figure Europe Market Sales Revenue Share by Type in 2020 Table Europe Market Sales Volume by Type 2015-2020 Table Europe Market Sales Volume Share by Type 2015-2020 Figure Europe Market Sales Volume Share by Type in 2020 3.4.2 Europe Price by Type Table Europe Price by Type 2015-2020 3.5 South America 3.5.1 South America Sales by Type Table South America Market Sales Revenue by Type 2015-2020 Table South America Market Sales Revenue Share by Type 2015-2020 Figure South America Market Sales Revenue Share by Type in 2020 Table South America Market Sales Volume by Type 2015-2020 Table South America Market Sales Volume Share by Type 2015-2020 Figure South America Market Sales Volume Share by Type in 2020 3.5.2 South America Price by Type Table South America Price by Type 2015-2020 3.6 Middle East & Africa 3.6.1 Middle East & Africa Sales by Type Table Middle East & Africa Market Sales Revenue by Type 2015-2020 Table Middle East & Africa Market Sales Revenue Share by Type 2015-2020 Figure Middle East & Africa Market Sales Revenue Share by Type in 2020 Table Middle East & Africa Market Sales Volume by Type 2015-2020 Table Middle East & Africa Market Sales Volume Share by Type 2015-2020 Figure Middle East & Africa Market Sales Volume Share by Type in 2020 3.6.2 Middle East & Africa Price by Type Table Middle East & Africa Price by Type 2015-2020 4 Global and Regional Market by Application 4.1 Global 4.1.1 Global Sales by Application Table Global Market Sales Revenue by Application 2015-2020 Table Global Market Sales Revenue Share by Application 2015-2020 Figure Global Market Sales Revenue Share by Application in 2020 Table Global Market Sales Volume by Application 2015-2020 Table Global Market Sales Volume Share by Application 2015-2020 Figure Global Market Sales Volume Share by Application in 2020 4.1.2 Global Price by Application Table Global Price by Application 2015-2020 4.2 Asia-Pacific 4.2.1 Asia-Pacific Sales by Application Table Asia-Pacific Market Sales Revenue by Application 2015-2020 Table Asia-Pacific Market Sales Revenue Share by Application 2015-2020 Figure Asia-Pacific Market Sales Revenue Share by Application in 2020 Table Asia-Pacific Market Sales Volume by Application 2015-2020 Table Asia-Pacific Market Sales Volume Share by Application 2015-2020 Figure Asia-Pacific Market Sales Volume Share by Application in 2020 4.2.2 Asia-Pacific Price by Application Table Asia-Pacific Price by Application 2015-2020 4.3 North America 4.3.1 North America Sales by Application Table North America Market Sales Revenue by Application 2015-2020 Table North America Market Sales Revenue Share by Application 2015-2020 Figure North America Market Sales Revenue Share by Application in 2020 Table North America Market Sales Volume by Application 2015-2020 Table North America Market Sales Volume Share by Application 2015-2020 Figure North America Market Sales Volume Share by Application in 2020 4.3.2 North America Price by Application Table North America Price by Application 2015-2020 4.4 Europe 4.4.1 Europe Market Sales by Application Table Europe Market Sales Revenue by Application 2015-2020 Table Europe Market Sales Revenue Share by Application 2015-2020 Figure Europe Market Sales Revenue Share by Application in 2020 Table Europe Market Sales Volume by Application 2015-2020 Table Europe Market Sales Volume Share by Application 2015-2020 Figure Europe Market Sales Volume Share by Application in 2020 4.4.2 Europe Price by Application Table Europe Price by Application 2015-2020 4.5 South America 4.5.1 South America Sales by Application Table South America Market Sales Revenue by Application 2015-2020 Table South America Market Sales Revenue Share by Application 2015-2020 Figure South America Market Sales Revenue Share by Application in 2020 Table South America Market Sales Volume by Application 2015-2020 Table South America Market Sales Volume Share by Application 2015-2020 Figure South America Market Sales Volume Share by Application in 2020 4.5.2 South America Price by Application Table South America Price by Application 2015-2020 4.6 Middle East & Africa 4.6.1 Middle East & Africa Sales by Application Table Middle East & Africa Market Sales Revenue by Application 2015-2020 Table Middle East & Africa Market Sales Revenue Share by Application 2015-2020 Figure Middle East & Africa Market Sales Revenue Share by Application in 2020 Table Middle East & Africa Market Sales Volume by Application 2015-2020 Table Middle East & Africa Market Sales Volume Share by Application 2015-2020 Figure Middle East & Africa Market Sales Volume Share by Application in 2020 4.6.2 Middle East & Africa Price by Application Table Middle East & Africa Price by Application 2015-2020 5 Regional Trade 5.1 Export Table Regional Export 2015-2020 (Million USD) Table Regional Export 2015-2020 (Volume) 5.2 Import Table Regional Import 2015-2020 (Million USD) Table Regional Import 2015-2020 (Volume) 6 Key Manufacturers 6.1 Emerson Electric 6.1.1 Company Information 6.1.2 Products Overview 6.1.3 Business Data (Capacity, Sales Revenue, Volume, Price, Cost and Margin) Table Sales Revenue, Volume, Price, Cost and Margin of Emerson Electric 6.2 Johnson Controls (Company Information, Products Overview & Business Data) 6.3 Mitsubishi Electric Corporation (Company Information, Products Overview & Business Data) 6.4 Bosch (Company Information, Products Overview & Business Data) 6.5 Daikin (Company Information, Products Overview & Business Data) 6.6 United Technologies (Company Information, Products Overview & Business Data) 6.7 Oilon (Company Information, Products Overview & Business Data) 6.8 Danfoss (Company Information, Products Overview & Business Data) 6.9 ARANER (Company Information, Products Overview & Business Data) 6.10 Fujitsu General (Company Information, Products Overview & Business Data) 6.11 LG Electronics (Company Information, Products Overview & Business Data) 6.12 Panasonic (Company Information, Products Overview & Business Data) 6.13 Carrier (Company Information, Products Overview & Business Data) 6.14 NIBE (Company Information, Products Overview & Business Data) 6.15 Kobe Steel (Company Information, Products Overview & Business Data) 6.16 Vicking Heating Engines (Company Information, Products Overview & Business Data) 6.17 Ochsner Energie Technik (Company Information, Products Overview & Business Data) 6.18 Hybrid Energy (Company Information, Products Overview & Business Data) 6.19 Mayekawa (Company Information, Products Overview & Business Data) 6.20 Conhitherm (Company Information, Products Overview & Business Data) 6.21 Durr Thermea (Company Information, Products Overview & Business Data) 6.22 Friotherm (Company Information, Products Overview & Business Data) 6.23 Star Refrigeration (Company Information, Products Overview & Business Data) 6.24 GEA Refrigeration (Company Information, Products Overview & Business Data) 6.25 Frigel (Company Information, Products Overview & Business Data) 6.26 Gree Electric (Company Information, Products Overview & Business Data) 6.27 Stiebel Eltron (Company Information, Products Overview & Business Data) 6.28 Swegon Group (Company Information, Products Overview & Business Data) 6.29 Sanden International (Company Information, Products Overview & Business Data) 6.30 Aermec (Company Information, Products Overview & Business Data) 6.31 Glen Dimplex (Company Information, Products Overview & Business Data) 6.32 Vaillant (Company Information, Products Overview & Business Data) 6.33 A. O. Smith (Company Information, Products Overview & Business Data) 6.34 Viessmann (Company Information, Products Overview & Business Data) 6.35 BDR Thermea Group (Company Information, Products Overview & Business Data) 7 Industry Upstream 7.1 Industry Chain Figure Industry Chain Overview 7.2 Raw Materials Figure Industrial Heat Pumps SWOT List 8 Market Environment 8.1 SWOT 8.2 Porter's Five Forces Figure Industrial Heat Pumps Porter's Five Forces 8.3 Coronavirus Impact on the Industry 8.3.1 Impact of Covid-19 on Production 8.3.2 Impact of Covid-19 on Demand 8.3.3 Impact of Covid-19 on Purchase & Use 8.3.4 Impact of Covid-19 on Price 8.3.5 Impact of Covid-19 on Others 9 Conclusion
