Extract:
Based on this comprehensive report published by Gravitas Market Insights, the EV Charging Infrastructure market is said to witness a significant growth during the forecast years between 2021 and 2028. The constantly growing carbon emission levels along with several other harmful gases budding from transportation industry has urged the need for opting Electric Vehicles; hence the demand for EV charging infrastructure has raised amongst the residential and commercial applications. In fact, several electronic vehicle manufacturers like Kia Motors, Volvo, Ford and Mercedes-Benz are actively working in partnership with charging infrastructure providers for convenience of charging stations.
Report Scope in detail:
This latest report edition of EV Charging Infrastructure market has been added to our huge database of detailed reports and this envisions to shape the future of all the related businesses. Our team of learned research analysts have studied in-depth and curated the report based on several aspects which include the overview of the market, driving forces, growth rate, market trends, market size, opportunities and challenges of the market; along with detailed competitive analysis on the regional as well as global level. The EV Charging Infrastructure market research report renders a thorough analysis of the market on a global aspect and aims on several market segmentation. This report also provides deeper perception into the latest trends of the market and pinpoints crucial product developments of the industry. Furthermore, the report collects numerous factors that have accredited to the growth of the market in the recent years.
EV Charging Infrastructure Market Segmentation:
By Current
- AC (Level 1, Level 2)
- DC (DC Fast Charging, Others)
By Charging Site
- Private
- Public
Regional Coverage
- North America
- United States
- Canada
- Mexico
- Europe
- UK
- Germany
- France
- Italy
- Spain
- Russia
- Rest of Europe
- Asia Pacific
- China
- India
- Japan
- Korea
- Australia
- Southeast Asia
- Rest of Asia-Pacific
- South America
- Brazil
- Argentina
- Colombia
- Rest of South America
- Middle East & Africa
- GCC
- South Africa
- Rest of Middle East & Africa
Competitive Analysis:
Eminent market players have been outlined in order to extract improved insights into the worldwide businesses. Our research reports offer all-inclusive information on various top most manufacturers that are operational across global regions. We provide company profiles which include detailed overview of the company, business information, business performance, crucial strategies implemented through the years.
Few of the Key Players Covered in Our Report:
- Greenway Infrastructure
- Schneider Electric
- Volkswagen AG
- E. ON SE
- Nissan Motor Co., Ltd.
- BMW Group
- ABB
- Siemens
- ChargePoint Inc.
- EVgo Services LLC.
- Blink Charging Co.
- Hyundai Motor Company
- Eaton
- Exxon Mobil
- Royal Dutch Shell PLC
- Volta
- Delta Electronics, Inc.
Impact of COVID19:
The COVID19 pandemic crippled the global economy, it resulted in a worldwide lockdown and this has majorly impacted numerous industries. Our industry experts are working round-the-clock to identify, accumulate and in-time deliver market analysis due to the effect of unprecedented decisions in COVID-19 repercussions on many businesses. The full version of this report will comprise the overall impact of the pandemic, and predicted alteration on the future outlook of the industry, by taking into the account the economic, political, technological and social parameters.
This research study involves broad usage of both secondary and primary data sources. The research process involves the identification of numerous factors which affect the industry, comprising the market environment, government policy, historical data, present trends in the market, competitive landscape, technological innovation, upcoming technologies and the technical progress in related industry, and market risks, opportunities, market barriers and challenges.
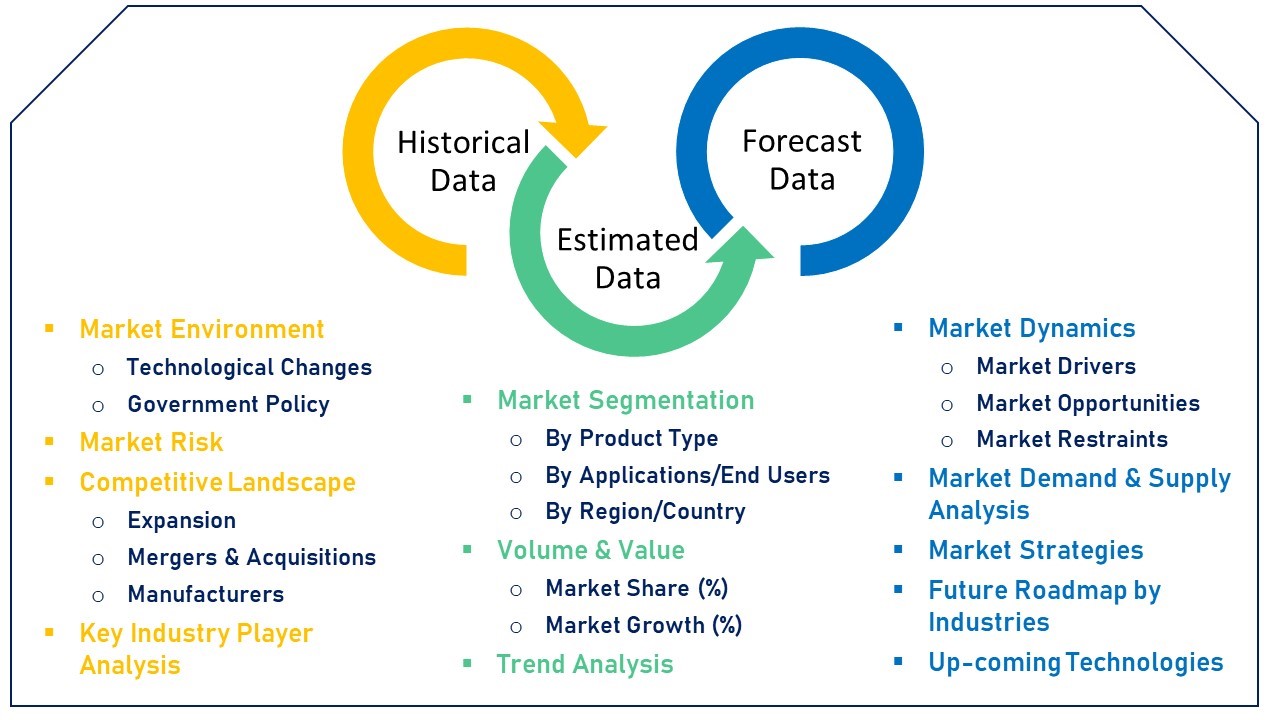
Market Estimation
Top-down and bottom-up approaches are used for validating the market size for companies, regional segments along with relevant market segmentations such as product type and application.
This report includes market estimations which are based on the marketed sale price of a product. Further breakdown of product segments, particular market share are formed based on the weightage assigned to every segment, which is derived of their usage rate and average price. The entire probable factors which effect the markets and influence them in a great way are included in this research report; and have been accounted for, studied in-depth and are confirmed through primary research. These are then studies to get the final qualitative and quantitative data. Any of the factors such as the outcome of inflation, economic downfall, and any kind of policy and regulatory alterations and/or other such factors are not accounted for in the market forecast. All of this data is amalgamated and included with thorough inputs and analysis from Gravitas Market Insights is curated in this report.
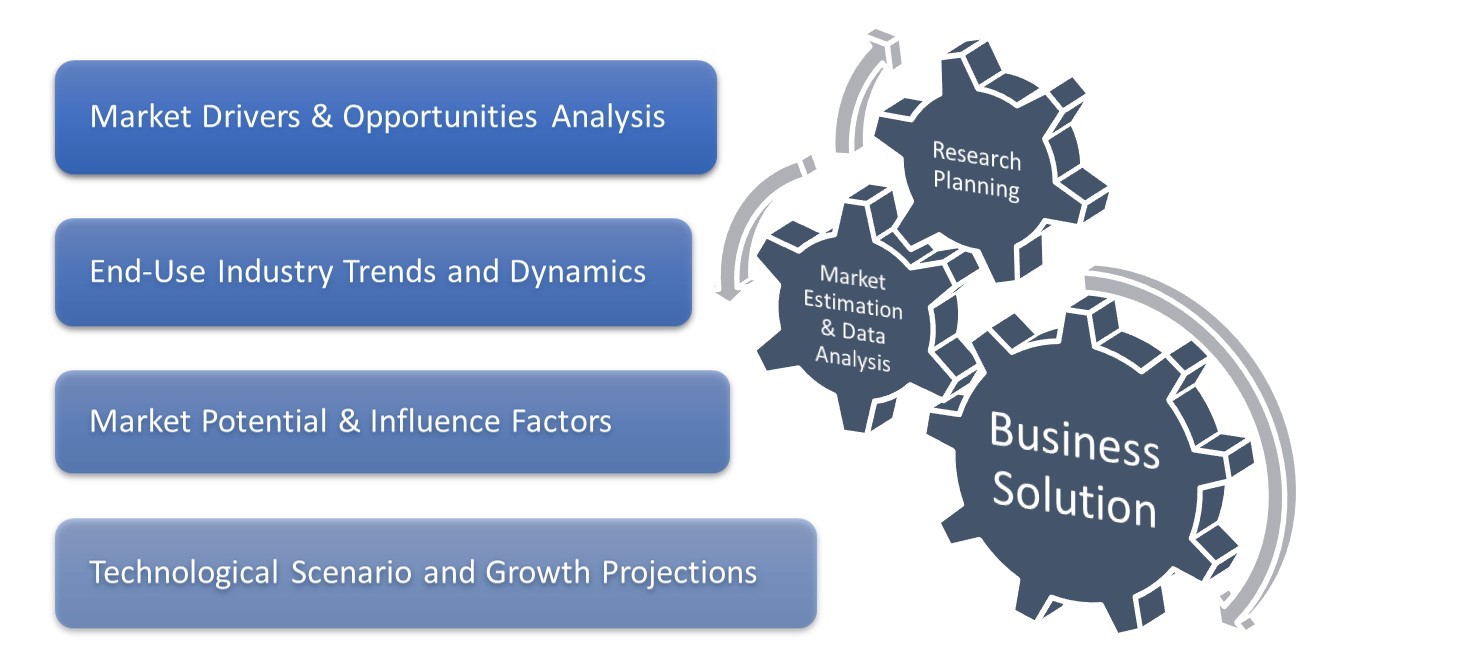
Along with the previously mentioned approaches, various data triangulation methods, in order to conduct market estimations and market forecasting for the complete market segments are detailed in this report. Key Companies present in the said market are also acknowledged via in-depth secondary research and primary research.
Section 1: Executive Summary
1.1. EV Charging Infrastructure Market Industry 360° outline, Year 2016 – 2028
1.2. Business Model Trends
1.3. Growth Trends
1.4. End-User/Charging Site Trends
1.5. Regional Trends
Section 2: Market Dynamics - EV Charging Infrastructure Market Industry Insights
2.1. Growth Drivers
2.2. Opportunities
2.3. Industry challenges
2.4. SWOT Analysis
2.5. Porter’s Analysis
2.6. Worldwide Industry Landscape, Year 2016 – 2028
2.7. Industry Segmentation
2.8. Technology & Invention landscape
2.9. Regional Landscape
2.9.1. North America
2.9.2. Europe
2.9.3. Asia-Pacific
2.9.4. South America
2.9.5. Middle East & Africa
2.10. Competitive Environment
Section 3: Global EV Charging Infrastructure Market, By Current
3.1. Segmentation Analysis, By Current, 2016-2028
3.2. Market Share Segmentation Analysis, By Current, 2016-2028
3.3. AC (Level 1, Level 2)
3.3.1. Market estimates and forecast with Growth rate analysis, 2016 – 2028
3.4. DC (DC Fast Charging, Others)
3.4.1. Market estimates and forecast with Growth rate analysis, 2016 – 2028
Section 4: Global EV Charging Infrastructure Market, By Charging Site
4.1. Segmentation Analysis, By Charging Site, 2016-2028
4.2. Market Share Segmentation Analysis, By Charging Site, 2016-2028
4.3. Private
4.3.1. Market estimates and forecast with Growth rate analysis, 2016 – 2028
4.4. Public
4.4.1. Market estimates and forecast with Growth rate analysis, 2016 – 2028
Section 5: Global EV Charging Infrastructure Market, Regional Analysis
5.1. Global EV Charging Infrastructure Market, Regional Analysis
5.2. North America, Country level Analysis
5.2.1. North America EV Charging Infrastructure Market estimates and forecast with Growth rate analysis, By Current, 2016 – 2028
5.2.2. North America EV Charging Infrastructure Market estimates and forecast with Growth rate analysis, By Charging Site, 2016 – 2028
5.2.3. United States
5.2.3.1. Market estimates and forecast with Growth rate analysis, 2016 – 2028
5.2.4. Canada
5.2.4.1. Market estimates and forecast with Growth rate analysis, 2016 – 2028
5.2.5. Mexico
5.2.5.1. Market estimates and forecast with Growth rate analysis, 2016 – 2028
5.3. Europe Country level Analysis
5.3.1. Europe EV Charging Infrastructure Market estimates and forecast with Growth rate analysis, By Current, 2016 – 2028
5.3.2. Europe EV Charging Infrastructure Market estimates and forecast with Growth rate analysis, By Charging Site, 2016 – 2028
5.3.3. UK
5.3.3.1. Market estimates and forecast with Growth rate analysis, 2016 – 2028
5.3.4. Germany
5.3.4.1. Market estimates and forecast with Growth rate analysis, 2016 – 2028
5.3.5. France
5.3.5.1. Market estimates and forecast with Growth rate analysis, 2016 – 2028
5.3.6. Italy
5.3.6.1. Market estimates and forecast with Growth rate analysis, 2016 – 2028
5.3.7. Spain
5.3.7.1. Market estimates and forecast with Growth rate analysis, 2016 – 2028
5.3.8. Russia
5.3.8.1. Market estimates and forecast with Growth rate analysis, 2016 – 2028
5.3.9. Rest of Europe
5.3.9.1. Market estimates and forecast with Growth rate analysis, 2016 – 2028
5.4. Asia-Pacific Country level Analysis
5.4.1. Asia-Pacific EV Charging Infrastructure Market estimates and forecast with Growth rate analysis, By Current, 2016 – 2028
5.4.2. Asia-Pacific EV Charging Infrastructure Market estimates and forecast with Growth rate analysis, By Charging Site, 2016 – 2028
5.4.3. China
5.4.3.1. Market estimates and forecast with Growth rate analysis, 2016 – 2028
5.4.4. India
5.4.4.1. Market estimates and forecast with Growth rate analysis, 2016 – 2028
5.4.5. Japan
5.4.5.1. Market estimates and forecast with Growth rate analysis, 2016 – 2028
5.4.6. Korea
5.4.6.1. Market estimates and forecast with Growth rate analysis, 2016 – 2028
5.4.7. Australia
5.4.7.1. Market estimates and forecast with Growth rate analysis, 2016 – 2028
5.4.8. Southeast Asia
5.4.8.1. Market estimates and forecast with Growth rate analysis, 2016 – 2028
5.4.9. Rest of Asia-Pacific
5.4.9.1. Market estimates and forecast with Growth rate analysis, 2016 – 2028
5.5. South America Country level Analysis
5.5.1. South America EV Charging Infrastructure Market estimates and forecast with Growth rate analysis, By Current, 2016 – 2028
5.5.2. South America EV Charging Infrastructure Market estimates and forecast with Growth rate analysis, By Charging Site, 2016 – 2028
5.5.3. Brazil
5.5.3.1. Market estimates and forecast with Growth rate analysis, 2016 – 2028
5.5.4. Argentina
5.5.4.1. Market estimates and forecast with Growth rate analysis, 2016 – 2028
5.5.5. Colombia
5.5.5.1. Market estimates and forecast with Growth rate analysis, 2016 – 2028
5.5.6. Rest of South America
5.5.6.1. Market estimates and forecast with Growth rate analysis, 2016 – 2028
5.6. Middle East & Africa Country level Analysis
5.6.1. MEA EV Charging Infrastructure Market estimates and forecast with Growth rate analysis, By Current, 2016 – 2028
5.6.2. MEA EV Charging Infrastructure Market estimates and forecast with Growth rate analysis, By Charging Site, 2016 – 2028
5.6.3. GCC
5.6.3.1. Market estimates and forecast with Growth rate analysis, 2016 – 2028
5.6.4. South Africa
5.6.4.1. Market estimates and forecast with Growth rate analysis, 2016 – 2028
5.6.5. Rest of Middle East & Africa
5.6.5.1. Market estimates and forecast with Growth rate analysis, 2016 – 2028
Section 6: Company Profile - EV Charging Infrastructure Market
6.1. Greenway Infrastructure
6.1.1. Business Overview
6.1.2. Product & Service Offering
6.1.3. Overall Revenue
6.1.4. Strategic Outlook
6.2. Schneider Electric
6.2.1. Business Overview
6.2.2. Product & Service Offering
6.2.3. Overall Revenue
6.2.4. Strategic Outlook
6.3. Volkswagen AG
6.3.1. Business Overview
6.3.2. Product & Service Offering
6.3.3. Overall Revenue
6.3.4. Strategic Outlook
6.4. E. ON SE
6.4.1. Business Overview
6.4.2. Product & Service Offering
6.4.3. Overall Revenue
6.4.4. Strategic Outlook
6.5. Nissan Motor Co., Ltd.
6.5.1. Business Overview
6.5.2. Product & Service Offering
6.5.3. Overall Revenue
6.5.4. Strategic Outlook
6.6. BMW Group
6.6.1. Business Overview
6.6.2. Product & Service Offering
6.6.3. Overall Revenue
6.6.4. Strategic Outlook
6.7. ABB
6.7.1. Business Overview
6.7.2. Product & Service Offering
6.7.3. Overall Revenue
6.7.4. Strategic Outlook
6.8. Siemens
6.8.1. Business Overview
6.8.2. Product & Service Offering
6.8.3. Overall Revenue
6.8.4. Strategic Outlook
6.9. ChargePoint Inc.
6.9.1. Business Overview
6.9.2. Product & Service Offering
6.9.3. Overall Revenue
6.9.4. Strategic Outlook
6.10. EVgo Services LLC.
6.10.1. Business Overview
6.10.2. Product & Service Offering
6.10.3. Overall Revenue
6.10.4. Strategic Outlook
6.11. Blink Charging Co.
6.11.1. Business Overview
6.11.2. Product & Service Offering
6.11.3. Overall Revenue
6.11.4. Strategic Outlook
6.12. Hyundai Motor Company
6.12.1. Business Overview
6.12.2. Product & Service Offering
6.12.3. Overall Revenue
6.12.4. Strategic Outlook
6.13. Eaton
6.13.1. Business Overview
6.13.2. Product & Service Offering
6.13.3. Overall Revenue
6.13.4. Strategic Outlook
6.14. Exxon Mobil
6.14.1. Business Overview
6.14.2. Product & Service Offering
6.14.3. Overall Revenue
6.14.4. Strategic Outlook
6.15. Royal Dutch Shell PLC
6.15.1. Business Overview
6.15.2. Product & Service Offering
6.15.3. Overall Revenue
6.15.4. Strategic Outlook
6.16. Volta
6.16.1. Business Overview
6.16.2. Product & Service Offering
6.16.3. Overall Revenue
6.16.4. Strategic Outlook
6.17. Delta Electronics, Inc.
6.17.1. Business Overview
6.17.2. Product & Service Offering
6.17.3. Overall Revenue
6.17.4. Strategic Outlook
*Market size and forecast will be provided from 2016-2028, and forecast period would be 2021-2028
*Details on financial performance and strategic moves and developments may not be captured for unlisted companies
*List of companies profiled in this TOC is tentative and may change after detailed analysis
