Emery Paper market is segmented by Type, and by Application. Players, stakeholders, and other participants in the global Emery Paper market will be able to gain the upper hand as they use the report as a powerful resource. The segmental analysis focuses on sales, revenue and forecast by Type and by Application for the period 2015-2026. Segment by Type, the Emery Paper market is segmented into Extra Fine Grades Very Fine Grades Fine Grades Medium Grades Coarse Grades Very Course Grades Extra Coarse Grades Segment by Application, the Emery Paper market is segmented into Metal Plastic Ceramics Wood Others Regional and Country-level Analysis The Emery Paper market is analysed and market size information is provided by regions (countries). The key regions covered in the Emery Paper market report are North America, Europe, Asia Pacific, Latin America, Middle East and Africa. It also covers key regions (countries), viz, U.S., Canada, Germany, France, U.K., Italy, Russia, China, Japan, South Korea, India, Australia, Taiwan, Indonesia, Thailand, Malaysia, Philippines, Vietnam, Mexico, Brazil, Turkey, Saudi Arabia, U.A.E, etc. The report includes country-wise and region-wise market size for the period 2015-2026. It also includes market size and forecast by Type, and by Application segment in terms of sales and revenue for the period 2015-2026. Competitive Landscape and Emery Paper Market Share Analysis Emery Paper market competitive landscape provides details and data information by players. The report offers comprehensive analysis and accurate statistics on revenue by the player for the period 2015-2020. It also offers detailed analysis supported by reliable statistics on revenue (global and regional level) by players for the period 2015-2020. Details included are company description, major business, company total revenue and the sales, revenue generated in Emery Paper business, the date to enter into the Emery Paper market, Emery Paper product introduction, recent developments, etc. The major vendors covered: Mirka SIA Ekamant Nihon Kenshi Gator Uneeda Kovax Luxin High-tech Fengmang Group Hubei Yuli Hubei Baota Krishna Trading Sankyo-Rikagaku Deerfos Awuko Saint-Gobain Klingspor Keystone Carborundum Universal Tun Jinn TOA-Sankyo Malani Taiyo Kenmazai Dongguan Golden Sun Changzhou Kingcattle Shandong Boss Abrasive Guangdong Little Sun
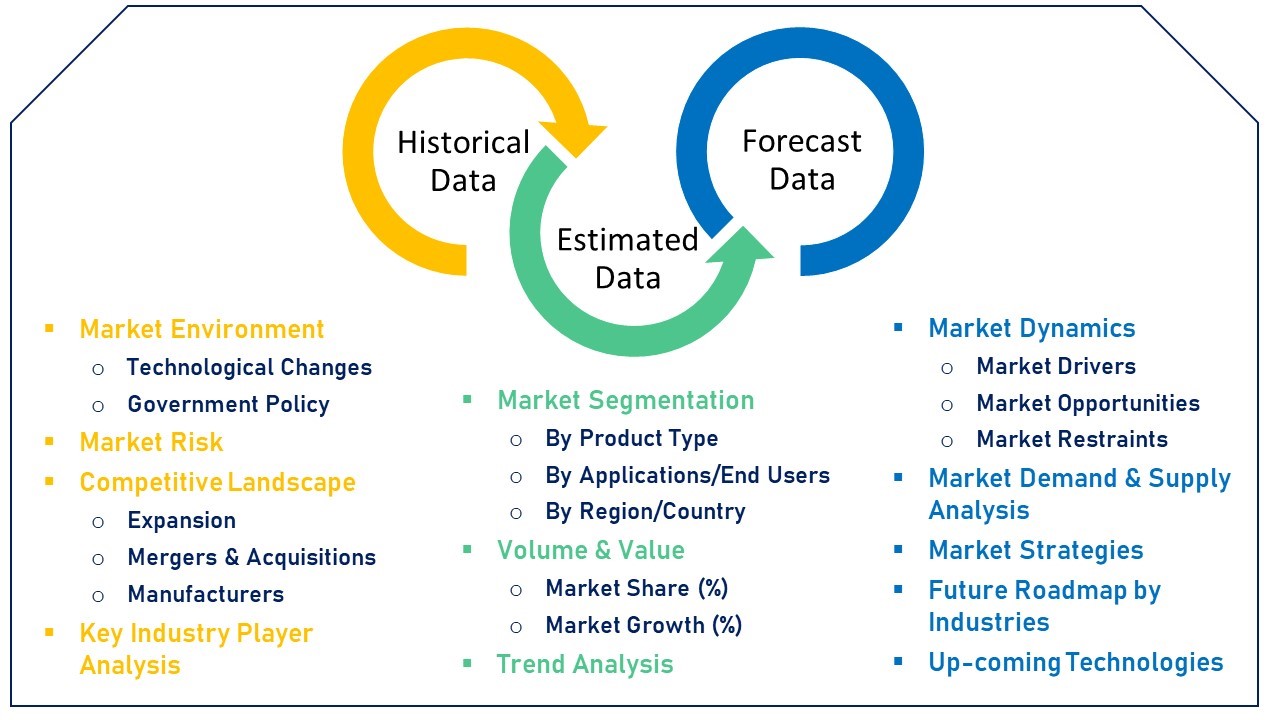
This research study involves broad usage of both secondary and primary data sources. The research process involves the identification of numerous factors which affect the industry, comprising the market environment, government policy, historical data, present trends in the market, competitive landscape, technological innovation, upcoming technologies and the technical progress in related industry, and market risks, opportunities, market barriers and challenges.
Market Estimation
Top-down and bottom-up approaches are used for validating the market size for companies, regional segments along with relevant market segmentations such as product type and application.
This report includes market estimations which are based on the marketed sale price of a product. Further breakdown of product segments, particular market share are formed based on the weightage assigned to every segment, which is derived of their usage rate and average price. The entire probable factors which effect the markets and influence them in a great way are included in this research report; and have been accounted for, studied in-depth and are confirmed through primary research. These are then studies to get the final qualitative and quantitative data. Any of the factors such as the outcome of inflation, economic downfall, and any kind of policy and regulatory alterations and/or other such factors are not accounted for in the market forecast. All of this data is amalgamated and included with thorough inputs and analysis from Gravitas Market Insights is curated in this report.
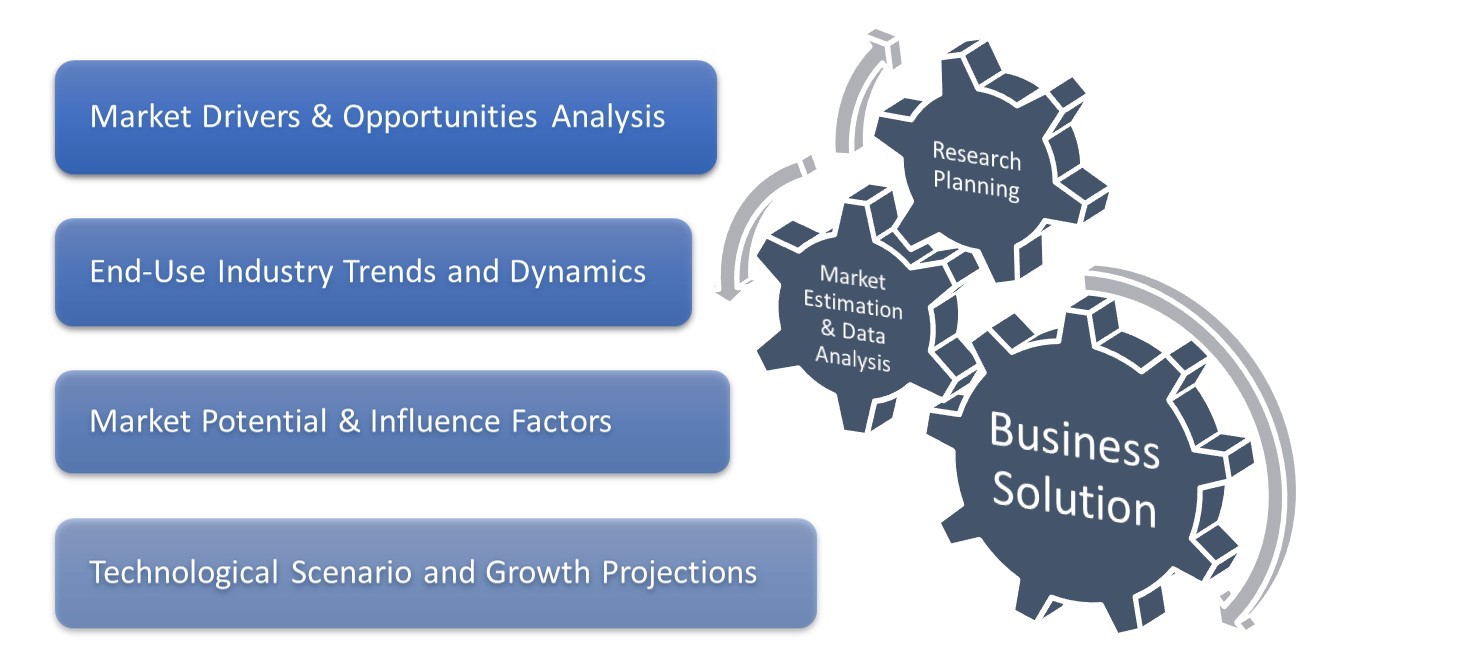
Along with the previously mentioned approaches, various data triangulation methods, in order to conduct market estimations and market forecasting for the complete market segments are detailed in this report. Key Companies present in the said market are also acknowledged via in-depth secondary research and primary research.
1 Study Coverage 1.1 Emery Paper Product Introduction 1.2 Market Segments 1.3 Key Emery Paper Manufacturers Covered: Ranking by Revenue 1.4 Market by Type 1.4.1 Global Emery Paper Market Size Growth Rate by Type 1.4.2 Extra Fine Grades 1.4.3 Very Fine Grades 1.4.4 Fine Grades 1.4.5 Medium Grades 1.4.6 Coarse Grades 1.4.7 Very Course Grades 1.4.8 Extra Coarse Grades 1.5 Market by Application 1.5.1 Global Emery Paper Market Size Growth Rate by Application 1.5.2 Metal 1.5.3 Plastic 1.5.4 Ceramics 1.5.5 Wood 1.5.6 Others 1.6 Coronavirus Disease 2019 (Covid-19): Emery Paper Industry Impact 1.6.1 How the Covid-19 is Affecting the Emery Paper Industry 1.6.1.1 Emery Paper Business Impact Assessment - Covid-19 1.6.1.2 Supply Chain Challenges 1.6.1.3 COVID-19?s Impact On Crude Oil and Refined Products 1.6.2 Market Trends and Emery Paper Potential Opportunities in the COVID-19 Landscape 1.6.3 Measures / Proposal against Covid-19 1.6.3.1 Government Measures to Combat Covid-19 Impact 1.6.3.2 Proposal for Emery Paper Players to Combat Covid-19 Impact 1.7 Study Objectives 1.8 Years Considered 2 Executive Summary 2.1 Global Emery Paper Market Size Estimates and Forecasts 2.1.1 Global Emery Paper Revenue 2015-2026 2.1.2 Global Emery Paper Sales 2015-2026 2.2 Emery Paper Market Size by Region: 2020 Versus 2026 2.2.1 Global Emery Paper Retrospective Market Scenario in Sales by Region: 2015-2020 2.2.2 Global Emery Paper Retrospective Market Scenario in Revenue by Region: 2015-2020 3 Global Emery Paper Competitor Landscape by Players 3.1 Emery Paper Sales by Manufacturers 3.1.1 Emery Paper Sales by Manufacturers (2015-2020) 3.1.2 Emery Paper Sales Market Share by Manufacturers (2015-2020) 3.2 Emery Paper Revenue by Manufacturers 3.2.1 Emery Paper Revenue by Manufacturers (2015-2020) 3.2.2 Emery Paper Revenue Share by Manufacturers (2015-2020) 3.2.3 Global Emery Paper Market Concentration Ratio (CR5 and HHI) (2015-2020) 3.2.4 Global Top 10 and Top 5 Companies by Emery Paper Revenue in 2019 3.2.5 Global Emery Paper Market Share by Company Type (Tier 1, Tier 2 and Tier 3) 3.3 Emery Paper Price by Manufacturers 3.4 Emery Paper Manufacturing Base Distribution, Product Types 3.4.1 Emery Paper Manufacturers Manufacturing Base Distribution, Headquarters 3.4.2 Manufacturers Emery Paper Product Type 3.4.3 Date of International Manufacturers Enter into Emery Paper Market 3.5 Manufacturers Mergers & Acquisitions, Expansion Plans 4 Breakdown Data by Type (2015-2026) 4.1 Global Emery Paper Market Size by Type (2015-2020) 4.1.1 Global Emery Paper Sales by Type (2015-2020) 4.1.2 Global Emery Paper Revenue by Type (2015-2020) 4.1.3 Emery Paper Average Selling Price (ASP) by Type (2015-2026) 4.2 Global Emery Paper Market Size Forecast by Type (2021-2026) 4.2.1 Global Emery Paper Sales Forecast by Type (2021-2026) 4.2.2 Global Emery Paper Revenue Forecast by Type (2021-2026) 4.2.3 Emery Paper Average Selling Price (ASP) Forecast by Type (2021-2026) 4.3 Global Emery Paper Market Share by Price Tier (2015-2020): Low-End, Mid-Range and High-End 5 Breakdown Data by Application (2015-2026) 5.1 Global Emery Paper Market Size by Application (2015-2020) 5.1.1 Global Emery Paper Sales by Application (2015-2020) 5.1.2 Global Emery Paper Revenue by Application (2015-2020) 5.1.3 Emery Paper Price by Application (2015-2020) 5.2 Emery Paper Market Size Forecast by Application (2021-2026) 5.2.1 Global Emery Paper Sales Forecast by Application (2021-2026) 5.2.2 Global Emery Paper Revenue Forecast by Application (2021-2026) 5.2.3 Global Emery Paper Price Forecast by Application (2021-2026) 6 North America 6.1 North America Emery Paper by Country 6.1.1 North America Emery Paper Sales by Country 6.1.2 North America Emery Paper Revenue by Country 6.1.3 U.S. 6.1.4 Canada 6.2 North America Emery Paper Market Facts & Figures by Type 6.3 North America Emery Paper Market Facts & Figures by Application 7 Europe 7.1 Europe Emery Paper by Country 7.1.1 Europe Emery Paper Sales by Country 7.1.2 Europe Emery Paper Revenue by Country 7.1.3 Germany 7.1.4 France 7.1.5 U.K. 7.1.6 Italy 7.1.7 Russia 7.2 Europe Emery Paper Market Facts & Figures by Type 7.3 Europe Emery Paper Market Facts & Figures by Application 8 Asia Pacific 8.1 Asia Pacific Emery Paper by Region 8.1.1 Asia Pacific Emery Paper Sales by Region 8.1.2 Asia Pacific Emery Paper Revenue by Region 8.1.3 China 8.1.4 Japan 8.1.5 South Korea 8.1.6 India 8.1.7 Australia 8.1.8 Taiwan 8.1.9 Indonesia 8.1.10 Thailand 8.1.11 Malaysia 8.1.12 Philippines 8.1.13 Vietnam 8.2 Asia Pacific Emery Paper Market Facts & Figures by Type 8.3 Asia Pacific Emery Paper Market Facts & Figures by Application 9 Latin America 9.1 Latin America Emery Paper by Country 9.1.1 Latin America Emery Paper Sales by Country 9.1.2 Latin America Emery Paper Revenue by Country 9.1.3 Mexico 9.1.4 Brazil 9.1.5 Argentina 9.2 Central & South America Emery Paper Market Facts & Figures by Type 9.3 Central & South America Emery Paper Market Facts & Figures by Application 10 Middle East and Africa 10.1 Middle East and Africa Emery Paper by Country 10.1.1 Middle East and Africa Emery Paper Sales by Country 10.1.2 Middle East and Africa Emery Paper Revenue by Country 10.1.3 Turkey 10.1.4 Saudi Arabia 10.1.5 U.A.E 10.2 Middle East and Africa Emery Paper Market Facts & Figures by Type 10.3 Middle East and Africa Emery Paper Market Facts & Figures by Application 11 Company Profiles 11.1 Mirka 11.1.1 Mirka Corporation Information 11.1.2 Mirka Description, Business Overview and Total Revenue 11.1.3 Mirka Sales, Revenue and Gross Margin (2015-2020) 11.1.4 Mirka Emery Paper Products Offered 11.1.5 Mirka Recent Development 11.2 SIA 11.2.1 SIA Corporation Information 11.2.2 SIA Description, Business Overview and Total Revenue 11.2.3 SIA Sales, Revenue and Gross Margin (2015-2020) 11.2.4 SIA Emery Paper Products Offered 11.2.5 SIA Recent Development 11.3 Ekamant 11.3.1 Ekamant Corporation Information 11.3.2 Ekamant Description, Business Overview and Total Revenue 11.3.3 Ekamant Sales, Revenue and Gross Margin (2015-2020) 11.3.4 Ekamant Emery Paper Products Offered 11.3.5 Ekamant Recent Development 11.4 Nihon Kenshi 11.4.1 Nihon Kenshi Corporation Information 11.4.2 Nihon Kenshi Description, Business Overview and Total Revenue 11.4.3 Nihon Kenshi Sales, Revenue and Gross Margin (2015-2020) 11.4.4 Nihon Kenshi Emery Paper Products Offered 11.4.5 Nihon Kenshi Recent Development 11.5 Gator 11.5.1 Gator Corporation Information 11.5.2 Gator Description, Business Overview and Total Revenue 11.5.3 Gator Sales, Revenue and Gross Margin (2015-2020) 11.5.4 Gator Emery Paper Products Offered 11.5.5 Gator Recent Development 11.6 Uneeda 11.6.1 Uneeda Corporation Information 11.6.2 Uneeda Description, Business Overview and Total Revenue 11.6.3 Uneeda Sales, Revenue and Gross Margin (2015-2020) 11.6.4 Uneeda Emery Paper Products Offered 11.6.5 Uneeda Recent Development 11.7 Kovax 11.7.1 Kovax Corporation Information 11.7.2 Kovax Description, Business Overview and Total Revenue 11.7.3 Kovax Sales, Revenue and Gross Margin (2015-2020) 11.7.4 Kovax Emery Paper Products Offered 11.7.5 Kovax Recent Development 11.8 Luxin High-tech 11.8.1 Luxin High-tech Corporation Information 11.8.2 Luxin High-tech Description, Business Overview and Total Revenue 11.8.3 Luxin High-tech Sales, Revenue and Gross Margin (2015-2020) 11.8.4 Luxin High-tech Emery Paper Products Offered 11.8.5 Luxin High-tech Recent Development 11.9 Fengmang Group 11.9.1 Fengmang Group Corporation Information 11.9.2 Fengmang Group Description, Business Overview and Total Revenue 11.9.3 Fengmang Group Sales, Revenue and Gross Margin (2015-2020) 11.9.4 Fengmang Group Emery Paper Products Offered 11.9.5 Fengmang Group Recent Development 11.10 Hubei Yuli 11.10.1 Hubei Yuli Corporation Information 11.10.2 Hubei Yuli Description, Business Overview and Total Revenue 11.10.3 Hubei Yuli Sales, Revenue and Gross Margin (2015-2020) 11.10.4 Hubei Yuli Emery Paper Products Offered 11.10.5 Hubei Yuli Recent Development 11.1 Mirka 11.1.1 Mirka Corporation Information 11.1.2 Mirka Description, Business Overview and Total Revenue 11.1.3 Mirka Sales, Revenue and Gross Margin (2015-2020) 11.1.4 Mirka Emery Paper Products Offered 11.1.5 Mirka Recent Development 11.12 Krishna Trading Sankyo-Rikagaku 11.12.1 Krishna Trading Sankyo-Rikagaku Corporation Information 11.12.2 Krishna Trading Sankyo-Rikagaku Description, Business Overview and Total Revenue 11.12.3 Krishna Trading Sankyo-Rikagaku Sales, Revenue and Gross Margin (2015-2020) 11.12.4 Krishna Trading Sankyo-Rikagaku Products Offered 11.12.5 Krishna Trading Sankyo-Rikagaku Recent Development 11.13 Deerfos 11.13.1 Deerfos Corporation Information 11.13.2 Deerfos Description, Business Overview and Total Revenue 11.13.3 Deerfos Sales, Revenue and Gross Margin (2015-2020) 11.13.4 Deerfos Products Offered 11.13.5 Deerfos Recent Development 11.14 Awuko 11.14.1 Awuko Corporation Information 11.14.2 Awuko Description, Business Overview and Total Revenue 11.14.3 Awuko Sales, Revenue and Gross Margin (2015-2020) 11.14.4 Awuko Products Offered 11.14.5 Awuko Recent Development 11.15 Saint-Gobain 11.15.1 Saint-Gobain Corporation Information 11.15.2 Saint-Gobain Description, Business Overview and Total Revenue 11.15.3 Saint-Gobain Sales, Revenue and Gross Margin (2015-2020) 11.15.4 Saint-Gobain Products Offered 11.15.5 Saint-Gobain Recent Development 11.16 Klingspor 11.16.1 Klingspor Corporation Information 11.16.2 Klingspor Description, Business Overview and Total Revenue 11.16.3 Klingspor Sales, Revenue and Gross Margin (2015-2020) 11.16.4 Klingspor Products Offered 11.16.5 Klingspor Recent Development 11.17 Keystone 11.17.1 Keystone Corporation Information 11.17.2 Keystone Description, Business Overview and Total Revenue 11.17.3 Keystone Sales, Revenue and Gross Margin (2015-2020) 11.17.4 Keystone Products Offered 11.17.5 Keystone Recent Development 11.18 Carborundum Universal 11.18.1 Carborundum Universal Corporation Information 11.18.2 Carborundum Universal Description, Business Overview and Total Revenue 11.18.3 Carborundum Universal Sales, Revenue and Gross Margin (2015-2020) 11.18.4 Carborundum Universal Products Offered 11.18.5 Carborundum Universal Recent Development 11.19 Tun Jinn 11.19.1 Tun Jinn Corporation Information 11.19.2 Tun Jinn Description, Business Overview and Total Revenue 11.19.3 Tun Jinn Sales, Revenue and Gross Margin (2015-2020) 11.19.4 Tun Jinn Products Offered 11.19.5 Tun Jinn Recent Development 11.20 TOA-Sankyo 11.20.1 TOA-Sankyo Corporation Information 11.20.2 TOA-Sankyo Description, Business Overview and Total Revenue 11.20.3 TOA-Sankyo Sales, Revenue and Gross Margin (2015-2020) 11.20.4 TOA-Sankyo Products Offered 11.20.5 TOA-Sankyo Recent Development 11.21 Malani 11.21.1 Malani Corporation Information 11.21.2 Malani Description, Business Overview and Total Revenue 11.21.3 Malani Sales, Revenue and Gross Margin (2015-2020) 11.21.4 Malani Products Offered 11.21.5 Malani Recent Development 11.22 Taiyo Kenmazai 11.22.1 Taiyo Kenmazai Corporation Information 11.22.2 Taiyo Kenmazai Description, Business Overview and Total Revenue 11.22.3 Taiyo Kenmazai Sales, Revenue and Gross Margin (2015-2020) 11.22.4 Taiyo Kenmazai Products Offered 11.22.5 Taiyo Kenmazai Recent Development 11.23 Dongguan Golden Sun 11.23.1 Dongguan Golden Sun Corporation Information 11.23.2 Dongguan Golden Sun Description, Business Overview and Total Revenue 11.23.3 Dongguan Golden Sun Sales, Revenue and Gross Margin (2015-2020) 11.23.4 Dongguan Golden Sun Products Offered 11.23.5 Dongguan Golden Sun Recent Development 11.24 Changzhou Kingcattle 11.24.1 Changzhou Kingcattle Corporation Information 11.24.2 Changzhou Kingcattle Description, Business Overview and Total Revenue 11.24.3 Changzhou Kingcattle Sales, Revenue and Gross Margin (2015-2020) 11.24.4 Changzhou Kingcattle Products Offered 11.24.5 Changzhou Kingcattle Recent Development 11.25 Shandong Boss Abrasive 11.25.1 Shandong Boss Abrasive Corporation Information 11.25.2 Shandong Boss Abrasive Description, Business Overview and Total Revenue 11.25.3 Shandong Boss Abrasive Sales, Revenue and Gross Margin (2015-2020) 11.25.4 Shandong Boss Abrasive Products Offered 11.25.5 Shandong Boss Abrasive Recent Development 11.26 Guangdong Little Sun 11.26.1 Guangdong Little Sun Corporation Information 11.26.2 Guangdong Little Sun Description, Business Overview and Total Revenue 11.26.3 Guangdong Little Sun Sales, Revenue and Gross Margin (2015-2020) 11.26.4 Guangdong Little Sun Products Offered 11.26.5 Guangdong Little Sun Recent Development 12 Future Forecast by Regions (Countries) (2021-2026) 12.1 Emery Paper Market Estimates and Projections by Region 12.1.1 Global Emery Paper Sales Forecast by Regions 2021-2026 12.1.2 Global Emery Paper Revenue Forecast by Regions 2021-2026 12.2 North America Emery Paper Market Size Forecast (2021-2026) 12.2.1 North America: Emery Paper Sales Forecast (2021-2026) 12.2.2 North America: Emery Paper Revenue Forecast (2021-2026) 12.2.3 North America: Emery Paper Market Size Forecast by Country (2021-2026) 12.3 Europe Emery Paper Market Size Forecast (2021-2026) 12.3.1 Europe: Emery Paper Sales Forecast (2021-2026) 12.3.2 Europe: Emery Paper Revenue Forecast (2021-2026) 12.3.3 Europe: Emery Paper Market Size Forecast by Country (2021-2026) 12.4 Asia Pacific Emery Paper Market Size Forecast (2021-2026) 12.4.1 Asia Pacific: Emery Paper Sales Forecast (2021-2026) 12.4.2 Asia Pacific: Emery Paper Revenue Forecast (2021-2026) 12.4.3 Asia Pacific: Emery Paper Market Size Forecast by Region (2021-2026) 12.5 Latin America Emery Paper Market Size Forecast (2021-2026) 12.5.1 Latin America: Emery Paper Sales Forecast (2021-2026) 12.5.2 Latin America: Emery Paper Revenue Forecast (2021-2026) 12.5.3 Latin America: Emery Paper Market Size Forecast by Country (2021-2026) 12.6 Middle East and Africa Emery Paper Market Size Forecast (2021-2026) 12.6.1 Middle East and Africa: Emery Paper Sales Forecast (2021-2026) 12.6.2 Middle East and Africa: Emery Paper Revenue Forecast (2021-2026) 12.6.3 Middle East and Africa: Emery Paper Market Size Forecast by Country (2021-2026) 13 Market Opportunities, Challenges, Risks and Influences Factors Analysis 13.1 Market Opportunities and Drivers 13.2 Market Challenges 13.3 Market Risks/Restraints 13.4 Porter?s Five Forces Analysis 13.5 Primary Interviews with Key Emery Paper Players (Opinion Leaders) 14 Value Chain and Sales Channels Analysis 14.1 Value Chain Analysis 14.2 Emery Paper Customers 14.3 Sales Channels Analysis 14.3.1 Sales Channels 14.3.2 Distributors 15 Research Findings and Conclusion 16 Appendix 16.1 Research Methodology 16.1.1 Methodology/Research Approach 16.1.2 Data Source 16.2 Author Details
Summary Market Segment as follows: By Region Asia-Pacific North America Europe South America Middle East & Africa By Type Extra Fine Grades Very Fine Grades Fine Grades Medium Grades Coarse Grades Very Course Grades Extra Coarse Grades By Application Metal Plastic Ceramics Wood Others By Company Mirka SIA Ekamant Nihon Kenshi Gator Uneeda Kovax Luxin High-tech Fengmang Group Hubei Yuli Hubei Baota Krishna Trading Sankyo-Rikagaku Deerfos Awuko Saint-Gobain Klingspor Keystone Carborundum Universal Tun Jinn TOA-Sankyo Malani Taiyo Kenmazai Dongguan Golden Sun Changzhou Kingcattle Shandong Boss Abrasive Guangdong Little Sun The main contents of the report including: Section 1: Product definition, type and application, global and regional market overview; Section 2: Global and regional Market competition by company; Section 3: Global and regional sales revenue, volume and price by type; Section 4: Global and regional sales revenue, volume and price by application; Section 5: Regional export and import; Section 6: Company information, business overview, sales data and product specifications; Section 7: Industry chain and raw materials; Section 8: SWOT and Porter's Five Forces; Section 9: Conclusion.
This research study involves broad usage of both secondary and primary data sources. The research process involves the identification of numerous factors which affect the industry, comprising the market environment, government policy, historical data, present trends in the market, competitive landscape, technological innovation, upcoming technologies and the technical progress in related industry, and market risks, opportunities, market barriers and challenges.
Market Estimation
Top-down and bottom-up approaches are used for validating the market size for companies, regional segments along with relevant market segmentations such as product type and application.
This report includes market estimations which are based on the marketed sale price of a product. Further breakdown of product segments, particular market share are formed based on the weightage assigned to every segment, which is derived of their usage rate and average price. The entire probable factors which effect the markets and influence them in a great way are included in this research report; and have been accounted for, studied in-depth and are confirmed through primary research. These are then studies to get the final qualitative and quantitative data. Any of the factors such as the outcome of inflation, economic downfall, and any kind of policy and regulatory alterations and/or other such factors are not accounted for in the market forecast. All of this data is amalgamated and included with thorough inputs and analysis from Gravitas Market Insights is curated in this report.
Along with the previously mentioned approaches, various data triangulation methods, in order to conduct market estimations and market forecasting for the complete market segments are detailed in this report. Key Companies present in the said market are also acknowledged via in-depth secondary research and primary research.
Table of Contents 1 Market Overview 1.1 Market Segment Overview 1.1.1 Product Definition 1.1.2 Market by Type 1.1.2.1 Extra Fine Grades Figure Extra Fine Grades Market Size and CAGR 2015-2020 (Million USD) Figure Extra Fine Grades Market Size and CAGR 2015-2020 (Volume) Figure Extra Fine Grades Market Forecast and CAGR 2020-2025 (Million USD) Figure Extra Fine Grades Market Forecast and CAGR 2020-2025 (Volume) 1.1.2.2 Very Fine Grades Figure Very Fine Grades Market Size and CAGR 2015-2020 (Million USD) Figure Very Fine Grades Market Size and CAGR 2015-2020 (Volume) Figure Very Fine Grades Market Forecast and CAGR 2020-2025 (Million USD) Figure Very Fine Grades Market Forecast and CAGR 2020-2025 (Volume) 1.1.2.3 Fine Grades Figure Fine Grades Market Size and CAGR 2015-2020 (Million USD) Figure Fine Grades Market Size and CAGR 2015-2020 (Volume) Figure Fine Grades Market Forecast and CAGR 2020-2025 (Million USD) Figure Fine Grades Market Forecast and CAGR 2020-2025 (Volume) 1.1.2.4 Medium Grades Figure Medium Grades Market Size and CAGR 2015-2020 (Million USD) Figure Medium Grades Market Size and CAGR 2015-2020 (Volume) Figure Medium Grades Market Forecast and CAGR 2020-2025 (Million USD) Figure Medium Grades Market Forecast and CAGR 2020-2025 (Volume) 1.1.2.5 Coarse Grades Figure Coarse Grades Market Size and CAGR 2015-2020 (Million USD) Figure Coarse Grades Market Size and CAGR 2015-2020 (Volume) Figure Coarse Grades Market Forecast and CAGR 2020-2025 (Million USD) Figure Coarse Grades Market Forecast and CAGR 2020-2025 (Volume) 1.1.2.6 Very Course Grades Figure Very Course Grades Market Size and CAGR 2015-2020 (Million USD) Figure Very Course Grades Market Size and CAGR 2015-2020 (Volume) Figure Very Course Grades Market Forecast and CAGR 2020-2025 (Million USD) Figure Very Course Grades Market Forecast and CAGR 2020-2025 (Volume) 1.1.2.7 Extra Coarse Grades Figure Extra Coarse Grades Market Size and CAGR 2015-2020 (Million USD) Figure Extra Coarse Grades Market Size and CAGR 2015-2020 (Volume) Figure Extra Coarse Grades Market Forecast and CAGR 2020-2025 (Million USD) Figure Extra Coarse Grades Market Forecast and CAGR 2020-2025 (Volume) 1.1.3 Market by Application 1.1.3.1 Metal Figure Metal Market Size and CAGR 2015-2020 (Million USD) Figure Metal Market Size and CAGR 2015-2020 (Volume) Figure Metal Market Forecast and CAGR 2020-2025 (Million USD) Figure Metal Market Forecast and CAGR 2020-2025 (Volume) 1.1.3.2 Plastic Figure Plastic Market Size and CAGR 2015-2020 (Million USD) Figure Plastic Market Size and CAGR 2015-2020 (Volume) Figure Plastic Market Forecast and CAGR 2020-2025 (Million USD) Figure Plastic Market Forecast and CAGR 2020-2025 (Volume) 1.1.3.3 Ceramics Figure Ceramics Market Size and CAGR 2015-2020 (Million USD) Figure Ceramics Market Size and CAGR 2015-2020 (Volume) Figure Ceramics Market Forecast and CAGR 2020-2025 (Million USD) Figure Ceramics Market Forecast and CAGR 2020-2025 (Volume) 1.1.3.4 Wood Figure Wood Market Size and CAGR 2015-2020 (Million USD) Figure Wood Market Size and CAGR 2015-2020 (Volume) Figure Wood Market Forecast and CAGR 2020-2025 (Million USD) Figure Wood Market Forecast and CAGR 2020-2025 (Volume) 1.1.3.5 Others Figure Others Market Size and CAGR 2015-2020 (Million USD) Figure Others Market Size and CAGR 2015-2020 (Volume) Figure Others Market Forecast and CAGR 2020-2025 (Million USD) Figure Others Market Forecast and CAGR 2020-2025 (Volume) 1.2 Global and Regional Market Size 1.2.1 Global Overview Figure Global Emery Paper Market Size and CAGR 2015-2020 (Million USD) Figure Global Emery Paper Market Size and CAGR 2015-2020 (Volume) Figure Global Emery Paper Market Forecast and CAGR 2020-2025 (Million USD) Figure Global Emery Paper Market Forecast and CAGR 2020-2025 (Volume) 1.2.2 Market by Region 1.2.2.1 Asia-Pacific Figure Asia-Pacific Emery Paper Market Size and CAGR 2015-2020 (Million USD) Figure Asia-Pacific Emery Paper Market Size and CAGR 2015-2020 (Volume) Figure Asia-Pacific Emery Paper Market Forecast and CAGR 2020-2025 (Million USD) Figure Asia-Pacific Emery Paper Market Forecast and CAGR 2020-2025 (Volume) 1.2.2.2 North America Figure North America Emery Paper Market Size and CAGR 2015-2020 (Million USD) Figure North America Emery Paper Market Size and CAGR 2015-2020 (Volume) Figure North America Emery Paper Market Forecast and CAGR 2020-2025 (Million USD) Figure North America Emery Paper Market Forecast and CAGR 2020-2025 (Volume) 1.2.2.3 Europe Figure Europe Emery Paper Market Size and CAGR 2015-2020 (Million USD) Figure Europe Emery Paper Market Size and CAGR 2015-2020 (Volume) Figure Europe Emery Paper Market Forecast and CAGR 2020-2025 (Million USD) Figure Europe Emery Paper Market Forecast and CAGR 2020-2025 (Volume) 1.2.2.4 South America Figure South America Emery Paper Market Size and CAGR 2015-2020 (Million USD) Figure South America Emery Paper Market Size and CAGR 2015-2020 (Volume) Figure South America Emery Paper Market Forecast and CAGR 2020-2025 (Million USD) Figure South America Emery Paper Market Forecast and CAGR 2020-2025 (Volume) 1.2.2.5 Middle East & Africa Figure Middle East & Africa Emery Paper Market Size and CAGR 2015-2020 (Million USD) Figure Middle East & Africa Emery Paper Market Size and CAGR 2015-2020 (Volume) Figure Middle East & Africa Emery Paper Market Forecast and CAGR 2020-2025 (Million USD) Figure Middle East & Africa Emery Paper Market Forecast and CAGR 2020-2025 (Volume) 2 Global and Regional Market by Company 2.1 Global 2.1.1 Global Sales by Company Table Global Market Sales Revenue by Company 2015-2020 Table Global Market Sales Revenue Share by Company 2015-2020 Figure Global Market Sales Revenue Share by Company in 2020 Table Global Market Sales Volume by Company 2015-2020 Table Global Market Sales Volume Share by Company 2015-2020 Figure Global Market Sales Volume Share by Company in 2020 2.1.2 Global Price by Company Table Global Price by Company 2015-2020 2.2 Asia-Pacific 2.2.1 Asia-Pacific Sales by Company Table Asia-Pacific Market Sales Revenue by Company 2015-2020 Table Asia-Pacific Market Sales Revenue Share by Company 2015-2020 Figure Asia-Pacific Market Sales Revenue Share by Company in 2020 Table Asia-Pacific Market Sales Volume by Company 2015-2020 Table Asia-Pacific Market Sales Volume Share by Company 2015-2020 Figure Asia-Pacific Market Sales Volume Share by Company in 2020 2.2.2 Asia-Pacific Price by Company Table Asia-Pacific Price by Company 2015-2020 2.3 North America 2.3.1 North America Sales by Company Table North America Market Sales Revenue by Company 2015-2020 Table North America Market Sales Revenue Share by Company 2015-2020 Figure North America Market Sales Revenue Share by Company in 2020 Table North America Market Sales Volume by Company 2015-2020 Table North America Market Sales Volume Share by Company 2015-2020 Figure North America Market Sales Volume Share by Company in 2020 2.3.2 North America Price by Company Table North America Price by Company 2015-2020 2.4 Europe 2.4.1 Europe Market Sales by Company Table Europe Market Sales Revenue by Company 2015-2020 Table Europe Market Sales Revenue Share by Company 2015-2020 Figure Europe Market Sales Revenue Share by Company in 2020 Table Europe Market Sales Volume by Company 2015-2020 Table Europe Market Sales Volume Share by Company 2015-2020 Figure Europe Market Sales Volume Share by Company in 2020 2.4.2 Europe Price by Company Table Europe Price by Company 2015-2020 2.5 South America 2.5.1 South America Sales by Company Table South America Market Sales Revenue by Company 2015-2020 Table South America Market Sales Revenue Share by Company 2015-2020 Figure South America Market Sales Revenue Share by Company in 2020 Table South America Market Sales Volume by Company 2015-2020 Table South America Market Sales Volume Share by Company 2015-2020 Figure South America Market Sales Volume Share by Company in 2020 2.5.2 South America Price by Company Table South America Price by Company 2015-2020 2.6 Middle East & Africa 2.6.1 Middle East & Africa Sales by Company Table Middle East & Africa Market Sales Revenue by Company 2015-2020 Table Middle East & Africa Market Sales Revenue Share by Company 2015-2020 Figure Middle East & Africa Market Sales Revenue Share by Company in 2020 Table Middle East & Africa Market Sales Volume by Company 2015-2020 Table Middle East & Africa Market Sales Volume Share by Company 2015-2020 Figure Middle East & Africa Market Sales Volume Share by Company in 2020 2.6.2 Middle East & Africa Price by Company Table Middle East & Africa Price by Company 2015-2020 3 Global and Regional Market by Type 3.1 Global 3.1.1 Global Sales by Type Table Global Market Sales Revenue by Type 2015-2020 Table Global Market Sales Revenue Share by Type 2015-2020 Figure Global Market Sales Revenue Share by Type in 2020 Table Global Market Sales Volume by Type 2015-2020 Table Global Market Sales Volume Share by Type 2015-2020 Figure Global Market Sales Volume Share by Type in 2020 3.1.2 Global Price by Type Table Global Price by Type 2015-2020 3.2 Asia-Pacific 3.2.1 Asia-Pacific Sales by Type Table Asia-Pacific Market Sales Revenue by Type 2015-2020 Table Asia-Pacific Market Sales Revenue Share by Type 2015-2020 Figure Asia-Pacific Market Sales Revenue Share by Type in 2020 Table Asia-Pacific Market Sales Volume by Type 2015-2020 Table Asia-Pacific Market Sales Volume Share by Type 2015-2020 Figure Asia-Pacific Market Sales Volume Share by Type in 2020 3.2.2 Asia-Pacific Price by Type Table Asia-Pacific Price by Type 2015-2020 3.3 North America 3.3.1 North America Sales by Type Table North America Market Sales Revenue by Type 2015-2020 Table North America Market Sales Revenue Share by Type 2015-2020 Figure North America Market Sales Revenue Share by Type in 2020 Table North America Market Sales Volume by Type 2015-2020 Table North America Market Sales Volume Share by Type 2015-2020 Figure North America Market Sales Volume Share by Type in 2020 3.3.2 North America Price by Type Table North America Price by Type 2015-2020 3.4 Europe 3.4.1 Europe Market Sales by Type Table Europe Market Sales Revenue by Type 2015-2020 Table Europe Market Sales Revenue Share by Type 2015-2020 Figure Europe Market Sales Revenue Share by Type in 2020 Table Europe Market Sales Volume by Type 2015-2020 Table Europe Market Sales Volume Share by Type 2015-2020 Figure Europe Market Sales Volume Share by Type in 2020 3.4.2 Europe Price by Type Table Europe Price by Type 2015-2020 3.5 South America 3.5.1 South America Sales by Type Table South America Market Sales Revenue by Type 2015-2020 Table South America Market Sales Revenue Share by Type 2015-2020 Figure South America Market Sales Revenue Share by Type in 2020 Table South America Market Sales Volume by Type 2015-2020 Table South America Market Sales Volume Share by Type 2015-2020 Figure South America Market Sales Volume Share by Type in 2020 3.5.2 South America Price by Type Table South America Price by Type 2015-2020 3.6 Middle East & Africa 3.6.1 Middle East & Africa Sales by Type Table Middle East & Africa Market Sales Revenue by Type 2015-2020 Table Middle East & Africa Market Sales Revenue Share by Type 2015-2020 Figure Middle East & Africa Market Sales Revenue Share by Type in 2020 Table Middle East & Africa Market Sales Volume by Type 2015-2020 Table Middle East & Africa Market Sales Volume Share by Type 2015-2020 Figure Middle East & Africa Market Sales Volume Share by Type in 2020 3.6.2 Middle East & Africa Price by Type Table Middle East & Africa Price by Type 2015-2020 4 Global and Regional Market by Application 4.1 Global 4.1.1 Global Sales by Application Table Global Market Sales Revenue by Application 2015-2020 Table Global Market Sales Revenue Share by Application 2015-2020 Figure Global Market Sales Revenue Share by Application in 2020 Table Global Market Sales Volume by Application 2015-2020 Table Global Market Sales Volume Share by Application 2015-2020 Figure Global Market Sales Volume Share by Application in 2020 4.1.2 Global Price by Application Table Global Price by Application 2015-2020 4.2 Asia-Pacific 4.2.1 Asia-Pacific Sales by Application Table Asia-Pacific Market Sales Revenue by Application 2015-2020 Table Asia-Pacific Market Sales Revenue Share by Application 2015-2020 Figure Asia-Pacific Market Sales Revenue Share by Application in 2020 Table Asia-Pacific Market Sales Volume by Application 2015-2020 Table Asia-Pacific Market Sales Volume Share by Application 2015-2020 Figure Asia-Pacific Market Sales Volume Share by Application in 2020 4.2.2 Asia-Pacific Price by Application Table Asia-Pacific Price by Application 2015-2020 4.3 North America 4.3.1 North America Sales by Application Table North America Market Sales Revenue by Application 2015-2020 Table North America Market Sales Revenue Share by Application 2015-2020 Figure North America Market Sales Revenue Share by Application in 2020 Table North America Market Sales Volume by Application 2015-2020 Table North America Market Sales Volume Share by Application 2015-2020 Figure North America Market Sales Volume Share by Application in 2020 4.3.2 North America Price by Application Table North America Price by Application 2015-2020 4.4 Europe 4.4.1 Europe Market Sales by Application Table Europe Market Sales Revenue by Application 2015-2020 Table Europe Market Sales Revenue Share by Application 2015-2020 Figure Europe Market Sales Revenue Share by Application in 2020 Table Europe Market Sales Volume by Application 2015-2020 Table Europe Market Sales Volume Share by Application 2015-2020 Figure Europe Market Sales Volume Share by Application in 2020 4.4.2 Europe Price by Application Table Europe Price by Application 2015-2020 4.5 South America 4.5.1 South America Sales by Application Table South America Market Sales Revenue by Application 2015-2020 Table South America Market Sales Revenue Share by Application 2015-2020 Figure South America Market Sales Revenue Share by Application in 2020 Table South America Market Sales Volume by Application 2015-2020 Table South America Market Sales Volume Share by Application 2015-2020 Figure South America Market Sales Volume Share by Application in 2020 4.5.2 South America Price by Application Table South America Price by Application 2015-2020 4.6 Middle East & Africa 4.6.1 Middle East & Africa Sales by Application Table Middle East & Africa Market Sales Revenue by Application 2015-2020 Table Middle East & Africa Market Sales Revenue Share by Application 2015-2020 Figure Middle East & Africa Market Sales Revenue Share by Application in 2020 Table Middle East & Africa Market Sales Volume by Application 2015-2020 Table Middle East & Africa Market Sales Volume Share by Application 2015-2020 Figure Middle East & Africa Market Sales Volume Share by Application in 2020 4.6.2 Middle East & Africa Price by Application Table Middle East & Africa Price by Application 2015-2020 5 Regional Trade 5.1 Export Table Regional Export 2015-2020 (Million USD) Table Regional Export 2015-2020 (Volume) 5.2 Import Table Regional Import 2015-2020 (Million USD) Table Regional Import 2015-2020 (Volume) 6 Key Manufacturers 6.1 Mirka 6.1.1 Company Information 6.1.2 Products Overview 6.1.3 Business Data (Capacity, Sales Revenue, Volume, Price, Cost and Margin) Table Sales Revenue, Volume, Price, Cost and Margin of Mirka 6.2 SIA (Company Information, Products Overview & Business Data) 6.3 Ekamant (Company Information, Products Overview & Business Data) 6.4 Nihon Kenshi (Company Information, Products Overview & Business Data) 6.5 Gator (Company Information, Products Overview & Business Data) 6.6 Uneeda (Company Information, Products Overview & Business Data) 6.7 Kovax (Company Information, Products Overview & Business Data) 6.8 Luxin High-tech (Company Information, Products Overview & Business Data) 6.9 Fengmang Group (Company Information, Products Overview & Business Data) 6.10 Hubei Yuli (Company Information, Products Overview & Business Data) 6.11 Hubei Baota (Company Information, Products Overview & Business Data) 6.12 Krishna Trading Sankyo-Rikagaku (Company Information, Products Overview & Business Data) 6.13 Deerfos (Company Information, Products Overview & Business Data) 6.14 Awuko (Company Information, Products Overview & Business Data) 6.15 Saint-Gobain (Company Information, Products Overview & Business Data) 6.16 Klingspor (Company Information, Products Overview & Business Data) 6.17 Keystone (Company Information, Products Overview & Business Data) 6.18 Carborundum Universal (Company Information, Products Overview & Business Data) 6.19 Tun Jinn (Company Information, Products Overview & Business Data) 6.20 TOA-Sankyo (Company Information, Products Overview & Business Data) 6.21 Malani (Company Information, Products Overview & Business Data) 6.22 Taiyo Kenmazai (Company Information, Products Overview & Business Data) 6.23 Dongguan Golden Sun (Company Information, Products Overview & Business Data) 6.24 Changzhou Kingcattle (Company Information, Products Overview & Business Data) 6.25 Shandong Boss Abrasive (Company Information, Products Overview & Business Data) 6.26 Guangdong Little Sun (Company Information, Products Overview & Business Data) 7 Industry Upstream 7.1 Industry Chain Figure Industry Chain Overview 7.2 Raw Materials Figure Emery Paper SWOT List 8 Market Environment 8.1 SWOT 8.2 Porter's Five Forces Figure Emery Paper Porter's Five Forces 8.3 Coronavirus Impact on the Industry 8.3.1 Impact of Covid-19 on Production 8.3.2 Impact of Covid-19 on Demand 8.3.3 Impact of Covid-19 on Purchase & Use 8.3.4 Impact of Covid-19 on Price 8.3.5 Impact of Covid-19 on Others 9 Conclusion
